In a lecture example, we used the convolution integral approach to study the response of an undamped oscillator excited by the rectangular pulse shown below.
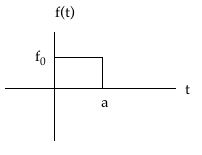
Here we will apply the graphical interpretation of the convolution integral to help understand the nature of this response in terms of the length of the pulse, a, compare to the natural period of free response for the system.
Long pulse: a >> Tn
Here we use the t < a part of the solution obtained. From this, we see that the maximum response is given by: xmax = 2f0/k. From our graphical interpretation method for the convolution integral, the maximum response occurs when the area under h(t) f(t-t) is a maximum. Viewing the animation below of the convolution process, this maximum occurs when the positive red area added to the negative blue area is a maximum Also, zero crossings of the solution occur at times when the positive red area is cancelled out by the negative blue area. Can you see these these times on the animation?
Short pulse: a << Tn/2
View the animation below for a short pulse. Notice that the maximum response occurs AFTER the pulse is turned off. Can you see why from this animation that the maximum response will be LESS than for the long pulse: xmax < 2f0/k. Also, check the above observations about when the maximum responses and zero crossings occur based on the graphical approach.
Intermediate pulse: a =Tn/2
View the animation below for this pulse. Notice that the maximum response occurs at the same instant that the pulse is turned off, with xmax < 2f0/k. Can you see whey this is true based on our graphical approach? Also, check the above observations about when the maximum responses and zero crossings occur based on the graphical approach. (Click here to view the QuickTime version of this animation that can be paused.)