| Problem statement Solution video https://youtu.be/FKGPH_FdtDw |
DISCUSSION THREAD
Discussion and hints

The above shows the results of simulations on this problem for two frequencies of excitation, ω. The upper plot where ω is less than the natural frequency, ωn, and the lower plot where ω is greater than ωn. In each plot, the RED curve is the forcing F(t) and the BLUE curve is the particular solution of the EOM, xP(t). As can be seen from these simulation results:
- The response for ω < ωn has the steady-state response of xP(t) moving in phase with the forcing F(t). That is, during the time that the block is displaced to the right, the force is acting to the right. Conversely, during the time that the block is displaced to the left, the force is acting to the left.
- The response for ω > ωn has the steady-state response of xP(t) moving 180° out of phase with the forcing F(t). That is, during the time that the block is displaced to the right, the force is acting to the left, and during the time that the block is displaced to the left, the force is acting to the right.
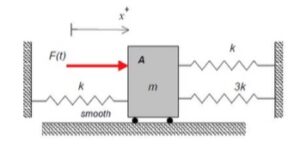
In your analysis for this problem, you will be determining the natural frequency ωn of the system, along with the steady-state response. Be sure to check your answer in the end: does it demonstrate the phase relations seen in the above simulation results?
Any questions?? Please ask/answer questions regarding this homework problem through the "Leave a Comment" link above.