Problem statements
Solution video – H35.A
Solution video – H35.B
DISCUSSION THREAD
Please post questions here on the homework, and take time to answer questions posted by others. You can learn both ways.
Problem statements
Solution video – H35.A
Solution video – H35.B
DISCUSSION THREAD
Comments are closed.
For this problem I found it helpful to make fbd for each section to find the functions for the moments on the graph. ( In addition to the fbd of the beam as a whole) Also I made sure to keep in mind that for the max stress we use the absolute value of the moment such that the sign is correct.
An alternative method to finding the moments of the beam is by using the graphical method. Because you know that the relationship between the shear force and moment is taking the integral, you can find the moment by finding the area under the curve of the shear force graph. Both methods yield the same results.
I think it is interesting that you decided to make FBDS for each section, which is something we learned in class a few weeks prior to the assignment of this homework. I think that would be helpful on the test if there is enough time in order to ensure that your diagrams are completely accurate.
I agree. I also used 4 FBDs to solve this problem. The first was an overall initial FBD to determine what Dx, Dy, and the moment at D was. And then the second FBD was of section AB, the third was section AC, and the forth was section AD. This allowed me to find all the shear force and bending moment equations for the graphs.
Another method is by integration. Instead of separating the figure into three segments, you can just find the reaction forces and moments with one FBD (two equations) and construct the shear force diagram accordingly. Then, since V = dM/dx, integrate the shear force diagram to find the moment diagram.
Yeah same here! Breaking it into sections with separate fbds made it way easier to figure out the moments. And good call on using the absolute value for stress—I almost forgot and had the wrong sign at first
This problem was very similar to the examples found on the blog. Overall it is helpful to use what is known about distributed loads and their impact on a shaft device to find the stresses.
I got confused by the lack of youngs modulus, but the question can be solved without it. You just need to find the moment about the bending point and plug it into the maximum stress equation. Aside from this the values of I are known because the shape is a square.
Yeah same! I thought we’d need Young’s modulus too at first, but since it’s just about max stress, all we need is the moment and I (which is easy since it’s a square). Just plug into Mc/I and you’re good.
I found this problem to be fun solving, I essentially used the knowledge we learned in the last weeks using graphical methods and differential/integral calculus to predict where M(x) attains its global extremum using the critical points by looking at the V(x) graph, then I used the stress relationship we learned today in class.
I think this wasn’t a bad problem, but drawing your FBD correctly is imperative to solving the rest of the problem. It is also important to remember that there are no distributed loads after C.
It is also important to remember that b is the entire side length of the square beam, so you need to divide b by 2 when plugging y(max) into the equation for the maximum normal stress.
I’m stuck trying to figure out where pure bending actually happens in this beam. I know it’s related to the shear force being zero, but I’m not sure how to spot that from the diagram or calculations. Any tips on how to find that?
You can determine where pure bending happens on the beam by using the shear force and bending moment diagrams to find the section (or point) where the shear force is equal to zero but there is a nonzero moment.
I would graph the shear force first and see where the function corsses the x axis, that is when M(x) attains pure bending. Don’t forget that when graphing V(x). Using that location, you can find M(x_interest) by using the relationship “dM/dx = V(x)” –> M(x_interest) represents M(0) + the net area from 0 to x_interest. It is basically applying optimization.
Would this still be the case if the shear graph isn’t consistent at the x-axis? Ex shear only crosses briefly before becoming positive.
Yes, even if the shear force only crosses the x-axis briefly, that crossing still indicates a point where V(x) = 0, which is the condition for pure bending. What matters is that the shear force is zero at that instant, regardless of how long it stays there. At that point, the bending moment is at a local max or min, because that’s where the slope of the moment curve (which is the shear) is zero. So as long as there’s a nonzero moment at that x-value, that’s where pure bending occurs.
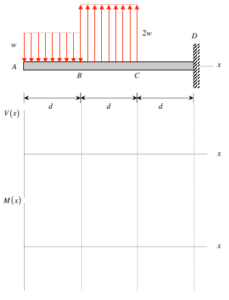
The shear force diagram will decrease at a constant rate until x = d and then increase at a constant rate until x = 2d. Between these two points, the shear force passes from being negative to being positive. Thus, there is a point where V = 0. Find the corresponding moment on the moment diagram and thats your max shear stress.
I found it helpful to sketch both the full FBD and smaller section FBDs to better understand how the shear and moment change across the beam. Once I had the shear diagram, it made it easier to spot where the moment was constant (pure bending) and where it hit a max. From there, plugging the moment into the stress formula was straightforward. I just had to remember to use the absolute value for max stress
When calculating the max normal stress, would you use b for ymax or sqrt(2b^2)?
I used b for ymax, then used ymax for the equation to find the maximum normal stress.
Since you take y-max from the center of the beam would it not have to be b/2?
I used B/2 for Ymax, as the Ymax would be half of the length of the beam. This ensures that the Ymax is at the exact middle of the beam, and therefore the stress calculations should be correct.
I used b for yMax
One helpful method when completing this problem’s moment diagram is considering which end to start the moment diagram at. I found that starting on the left side meant I did not have to do as much calculations as starting from the right side would necessitate.
Do we need to use Young’s modulus to solve this? I think a good FBD with all forces correct should make the problem very easy as its similar to other homeworks we’ve done in the past and examples we have done in class. I think the best way is to take the integral under the shear force graph.
To solve this, I used the shear force diagram to determine where pure bending happens. This is when the shear force is zero but there is a moment. I used the bending moment at that point in the formula to find the maximum stress.
I was kind of confused with finding regions of pure bending, but then learned that it pure bending can also occur at a single point, which is when the V(x) is 0.
Regarding Young’s modulus, I initially had the same confusion, but then realized the modulus isn’t needed here since the question solely asks for the maximum stress. Stress is directly related to the moment and geometry (M*c/I), and since the cross-section is clearly defined as a square, the calculations are straightforward.
Also, emphasis on using graphical methods for finding moments definitely simplifies this kind of analysis, especially under test conditions when efficiency matters.
After finding where the shear force is zero (pure bending), you can use the equation for normal stress. To find the y and I values you can search them up online, but they are (b/2) and (b^4)/12 respectively. It’s also important to keep units in check since we have forces initially in kN and our cross sectional distance in mm.
For this problem you will need to know how to calculate I. This is a formula that was given to us in class so refer to that.
I can not seem to find the formula. What exact formula is it?
I used the shear diagram to find where the shear force is zero, since that’s where the bending moment is at a max. Then I plugged that moment into the max stress formula, using the equation for I given in class.
This problem isn’t particularly difficult if you follow the systematic approach to finding the bending moment and shear moments like the previous homework. I is weird because of the geometry of the shape but it isn’t hard to plug in since it is a square. The shear diagram will help you find the critical point.
I found this problem very similar to the HW 29 we did a few weeks ago. After doing both the shear force and bending moment, finding the location of max stress is just looking for
v(x) = 0. From there we look at the max moment at the location and find the max stress from there.
I agree Alden, it was very straightforward. It was very helpful to check my work against a graph showing the shear stress and moment. Additionally, the max shear is straight forward using b/2 to find y_max as it is measured from the center of the beam.
How do we represent the change in moment in the moment graph when there is a distributed load- I know that it is parabolic but I do not know what kind?
It will always be a downward opening parabola if it is a constant downward distributed load.
Drawing both the full and section FBDs helped me understand how shear and moment change. I used the shear diagram to find where V(x) = 0, then used that point to find max moment and plug into the stress formula. We didn’t need Young’s modulus—just M, y = b/2, and I = b⁴/12. Keeping units consistent was key. Starting from the left made the moment diagram quicker to draw.
I looked at the lecture slides for this problem and then started by using the graphs to determine where the actual pure bending moments where. I then used the systematic approach that was layed out in the slides and thought the problem though. I used like others b/2 to find the Y max.
I saw that no load acts past point C which helped to know that moment would stay constant there. You also don’t need Young’s modulus when you’re just asked for max stress, this confused me at first.
I used section FBDs to get V(x), then integrated to find M(x) and locate the max.
Be careful when drawing the shear and moment diagrams. When drawing the shear diagram, it is important to show a linear decrease or increase wherever distributed loads are present. Therefore, the corresponding moment diagram would have a quadratic behavior.
To be able to solve this problem, I divided the beam up into 3 different sections. From this I found what the bending moment and shear force equations were for the diagram. Next, I was able to find the pure bending moment at the point where the shear force was zero, and the bending moment was not zero. From this I calculated the max normal stress through the equation of absolute value of moment * radius of cross section / moment of inertia, to get a final answer in Mpa.
Does anyone understand the implications of having both distributed loads overlap for an instance at point B? Does that change anything when drawing the shear and bending moment diagrams by inspection?
I am pretty sure that the figure only looks like that to show that one distributed load starts immediately where the other ends. When I solved this problem, I used that assumption and neglected any potential hiccups from overlapping loads.
That shouldn’t change anything for the graphs. Think of it like the downwards force is acting from 0 < x < d instead of x <= d. The same goes for the upwards force from d to 2d.
Since the equivalent force on a system from a distributed load is the integral of the load across the length of the load, the point at which the two sections meet would have a negligible impact on the total forces and the shear and moment diagrams.
I had a bit of difficulty determining how to compose the moment graphs for this. What helped me was to view this graph as the integral of shear and plot accordingly. I also found it helpful to go over the examples from in class, which helped me better understand where pure bending would occur in relation to the shear force.
I agree that viewing the moment graph as the integral of the shear graph was very useful. This allowed me to compose the moment graph using techniques similar to the hw for composing the diagrams graphically. Those examples were helpful when completing this hw.
One thing to note about this is that since the shear force is increasing from x = d to x = 2d, the moment for this section will be concave up. However, since the shear force is still negative over part of this segment, the moment will dip and reach its maximum magnitude when V = 0.
Good point, since the shear is increasing, the moment curve is concave up, but because the shear is still negative at first, the moment keeps decreasing until the shear hits zero, where the moment reaches its maximum (so most negative) value.
Breaking the beam into sections and drawing individual fbdss made it easier to find the moment equations for each part of the graph. Keeping the full beam FBD helped verify everything, and remembering to use the absolute value of the moment for max stress ensured the final answer had the correct sign and magnitude