
Proposal Dashboard User Guide
July 2020
This dashboard provides an overview of Sponsored Program Proposal Trends. This document provides high-level guidance for using the Tableau dashboard.
Access the Proposal Dashboard
Open the Proposal Dashboard in Tableau
Access requires Purdue career account login and BoilerKey authentication.
Accessing the Dashboard
The dashboard is accessible at the link above or by navigating on the SPS website.
Access to the dashboard requires Purdue career account login and BoilerKey authentication.
Mobile Access
The dashboard is also accessible on a mobile device by downloading the Tableau Mobile app.
To sign in via the mobile app, enter the server as tableau.itap.purdue.edu and login utilizing a Purdue career account login and BoilerKey authentication.
Layout Options
The dashboard is customizable for viewing on either a desktop or a tablet. This setting is in the upper right hand corner of the screen.

Filters
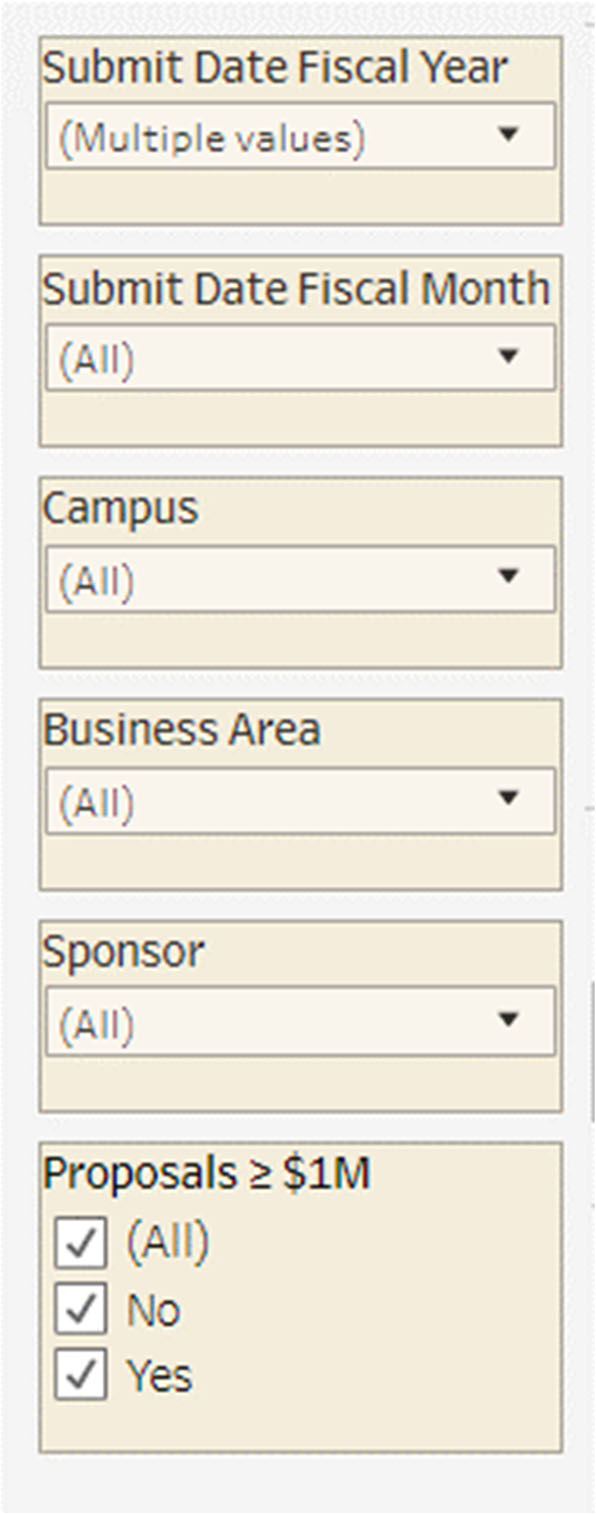
Filters are located at the left side of the screen.
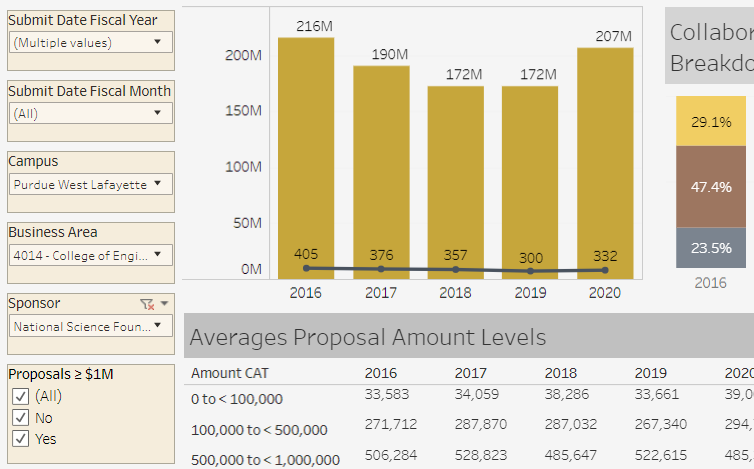
Please Note: Once filtered, these will apply for all of the tabs within the Tableau dashboard.
Users can filter for:
- Specific fiscal years/months
- Campus
- Specific business area (college/school)
- Sponsor
- Proposals greater than $1M
Data Descriptions
The Tableau dashboard includes multiple tabs of data found in the upper left corner. A description of the data available on each tab is listed below.

The current fiscal year (FY) will only include data through the most recent month.
The recommendation is to set the Submit Date Fiscal Month filter to compare current FY-to-date data with the same number of months in past FYs.
More details may be available by hovering the cursor over the specific data point.
Proposal Overview
- Overall Volume - count and dollars of proposals across FY
- Collaboration Breakdown - percentage of proposals by level of collaboration; single investigator, multi-departmental (only Purdue), multi-institutional
- Proposal Type - overall percentage of proposals by the type of proposal; new/resubmission, continuation, supplement, renewal for the filtered time frame
- Averages Proposal Amount Levels - average of the proposal amount within various ranges of proposal funding levels
- Proposal Amount Levels Count - number of proposals within the various ranges of proposal funding levels across FY
- Activity Type - proposal funding requested by activity type; fellowships, instruction, extension, research
Proposal Sponsor
- Sponsor Breakdown - proposal funding amounts across FY by sponsor type; PRF/Purdue, State/Local Government, Foreign Government, Industrial/Foundation, Federal
- Profit/Non-Profit - proposal funding amounts across FY for profit vs non-profit
- Federal Agency - count of proposals and dollar amount trends across FY for major federal sponsors; National Science Foundation, Department of Health and Human Services, Department of Defense, Department of Energy, Department of Agriculture, Other Federal
Proposal Details
- Principal Investigator Groups - breaks down the number of unique PIs by their position; professor, associate, assistant, admin & other, instructor
- First Submission at Purdue - gives the number of first time submitters at Purdue across FY by their position; professor, associate, assistant, admin & other, instructor
- Success Rate - success rate (awarded, pending, not funded) by proposal type (new/resubmission, renewal, supplement) for proposals submitted in the filtered time frame
- New/Resubmission - A new project or revision record of a previously submitted new project. Resubmission records overwrite the data from the previously submitted new record.
- Renewal - A competitive proposal that requests an additional award that will continue funding a previously awarded study.
- Supplement - Proposal that requests additional funding, equipment, time, etc. for an existing award and project period.
- Overall Proposal Success Rate - overall success rate (awarded) for all submissions within the filtered time frame
- Monthly Submissions - trend of proposal count by month across FYs
