Using Nuclear Chemistry to Investigate Radiocarbon Dating
In this collection of lab-based activities, students will learn about the concepts of radiation and half-life in order to gain an understanding of the use of radiocarbon dating as a method of absolute dating. Students will visualize radiation using cloud chambers and simulate radioactive decay using a dice roller. Using nuclear scalers will allow students to determine the half-life of a Ba-137m radioisotope. Additionally, students will learn calculations related to radioactive decay and use those calculations to determine whether a collection of artifacts are authentic or fake.
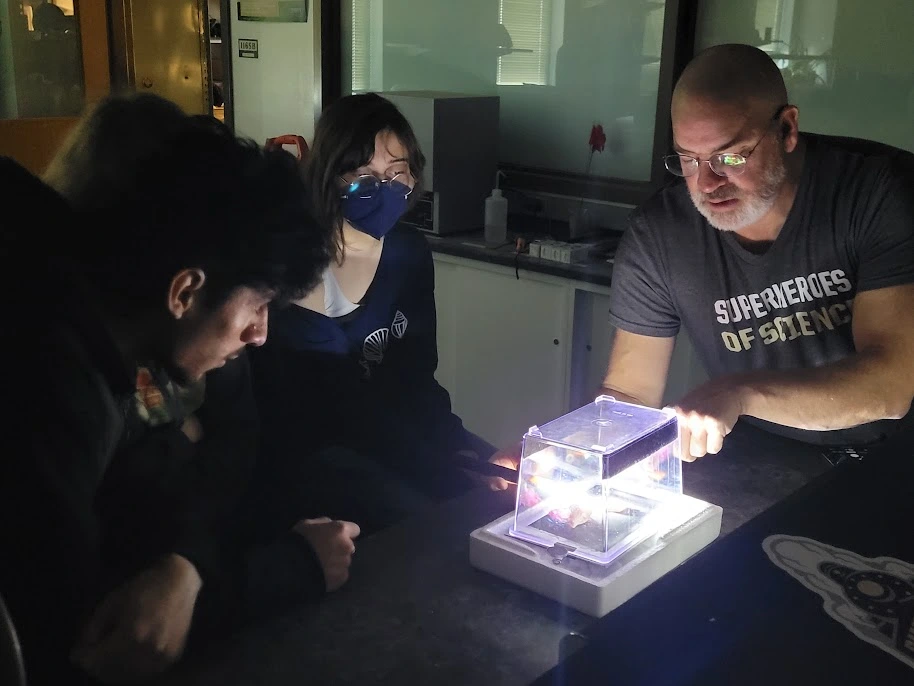
Photo 1. HOPS Lab participants observing radioactive particles in a cloud chamber.
Learning Objectives
- Students will understand that radioactive decay is a random process.
- Students will graphically determine the half-life of a radioisotope.
- Students will calculate the decay constant from a known half-life value and use that to determine the age and authenticity of an artifact.
Geologic Time Scale
Since our planet doesn't come with a written history, researching and dating past events allows us to piece together 4.6 billion years of Earth's history.
While the Geologic Time Scale tells us the order in which things happened (Relative Dating), geochronology provides the actual dates (Absolute Dating).
The primary tool of geochronology is radiometric dating.
Scientists measure the ratio between a "parent" isotope and its "daughter" product.
The activities below will help you better understand half-life and isotopes.
Cloud Chamber
A cloud chamber is an apparatus that uses a supersaturated vapor cloud (from a volatile liquid like isopropyl alcohol) to visualize interactions with charged (radioactive) particles. When charged particles ionize a supersaturated vapor, a trail of ions is left in the path of those particles. The ions act as condensation nuclei (for the alcohol to condense on) and a thin line of fine droplets is formed in the path of each charged particle.
The following video demonstrates how to setup a cloud chamber.
Radiation is all around us, even though we don't see or feel it. Through the use of certain apparatus such as cloud chambers, nuclear scalers, and Geiger counters, we can observe the presence of radiation in our environment. Geomorphologists, like Professor Nathaniel Lifton, depend on radiation to help them determine how long materials found on Earth's surface have been present.
In the following video, Professor Lifton explains cosmic rays and how a cloud chamber can help visualize these particles.
MATERIALS
Student Handout
DISCUSSION
- Where do cosmic rays originate?
- What are two of the most common cosmic ray particles?
- Briefly explain what happens when a cosmic ray enters a cloud chamber.
- List three types of particles that can be visualized in a cloud chamber.
- Where is carbon-14 formed?
- What is the half-life of carbon-14?
- What is the detection limit of carbon-14 today?
- List two commonly used isotope pairs that can be used to date materials older than 50-000 - 60,000 years.
- What type of mineral (that traps carbon-14) does Professor Lifton use in his research?
- How many years does it take for carbon-14 to reach its saturation concentration in materials sitting continuously at the Earth’s surface?
Modeling Nuclear Decay
To understand the randomness of radioactive decay, we can simulate the behavior of radioactive atoms. In this activity, a virtual "dice roller" will help to model the decay process of a radioactive sample. We will use 24 6-sided dice to represent the radioactive atoms, "dice-ium." The term half-life refers to the average time required for half of the radioactive sample to decay, i.e., be converted into another species. By comparing the number of remaining radioactive atoms to the number of non-radioactive atoms over time, the half-life of a radioactive sample can be determined.
MATERIALS
Student Handouts
- Modeling Nuclear Decay Data Table
- Data Analysis for Modeling Nuclear Decay
- Modeling Nuclear Decay Discussion Questions
Virtual Dice Roller
PROCEDURE
Begin with 24 6-sided dice. In the virtual dice roller, input the number '24'.
Initially, EACH of the 24 dice represent our sample of both radioactive and non-radioactive atoms. There are ZERO non-radioactive atoms. Complete the first row of the student handout, "Modeling Nuclear Decay Data Table" (Toss Number = 0), by filling in the number of radioactive "dice-ium" atoms, the number of non-radioactive "dice-ium" atoms, and the total number of atoms. (The total number of atoms in the sample will be equal to 24.)
Next, virtually roll the 24 "dice-ium" atoms. (Select "Roll!" on the virtual dice roller.)
Count the number of "dice-ium" atoms that show a '6'. All "dice-ium" that show a '6' are now considered non-radioactive. Complete the next row of the data table (Toss Number = 1). The number of radioactive "dice-ium" atoms are any dice that show a number 1 - 5. (The total number of atoms in the sample will still be equal to 24.)
Adjust the number of dice that you will be rolling in the virtual dice roller to match the number of radioactive "dice-ium" atoms from Toss Number = 1. Then virtually roll those dice by selecting "Roll!" on the virtual dice roller.
Count the number of "dice-ium" atoms that show a '6'. Complete the next row of the data table (Toss Number = 2). Remember the number of radioactive "dice-ium" atoms are any dice that show a number 1 - 5 and the number of non-radioactive atoms are any dice that show a '6'. (You should notice that the total number of atoms remains equal to 24. The number of radioactive atoms should be decreasing and the number of non-radioactive atoms should be increasing.)
Repeat this process until you have two or fewer radioactive "dice-ium" atoms remaining in the sample.
DATA ANALYSIS
On a sheet of graph paper, draw intersecting x- and y-axes with the origin located in the bottom left corner.
Label the y-axis: Radioactive "dice-ium" atoms
Label the x-axis: Time (years) *Each "Toss" value, indicated in the first column of the data table (student handout), is equivalent to one year.
Plot the points from the data table as an ordered pair (x,y).
- The 'x' is equal to the year value.
- The 'y' is equal to the number of radioactive "dice-ium" atoms.
- EXAMPLE: The FIRST point would be (0, 24). Time = 0 years and all 24 radioactive "dice-ium" atoms remain.
Draw a smooth, best-fit CURVE through the data points.
Find the point on the y-axis where the remaining radioactive "dice-ium" atoms is exactly one-half of the atoms at Time = 0 minutes. (HINT: What is half of 24?)
Starting at the one-half value on the y-axis, draw a line parallel to the x-axis until the line reaches the best-fit curve.
When the parallel line reaches the curve, draw a vertical line DOWN to the x-axis.
The point where the vertical line touches the x-axis is the half-life of radioactive "dice-ium" atoms in years.
DISCUSSION
- Since each die represents a radioactive nucleus of an atom, explain why the "total number of atoms" stayed the same after each toss.
- With each toss (year), were there more or fewer radioactive "dice-ium" atoms remaining?
- Does your answer to Question 2 indicate that "dice-ium" atoms are becoming more stable or less stable with each toss (year)?
- What is the half-life of "dice-ium"? (Be sure to label the answer with the appropriate units.)
- Was it possible to tell which radioactive "dice-ium" atoms were going to decay (show the number '6') BEFORE you clicked "Roll!" on the virtual dice roller? Explain.
Measuring Half-Life of a Radioisotope
The half-life of a radioisotope is defined as the amount of time necessary for one-half the quantity of nuclide (i.e. the amount of radioisotope) to decay. In this activity, a nuclear scaler is used to detect radiation that evolves from the decay of a Ba-137 radioisotope. The nuclear scaler works by applying a high voltage to a detector, which generates an electrical signal each time radiation passes through the detector. Students will take radiation counts every minute for twenty minutes, and then graph the data to determine the half-life of Ba-137.
MATERIALS
Student Handouts
- Data Table for Measuring Half-Life of a Radioisotope
- Data Analysis for Measuring Half-Life of a Radioisotope
- Pre-Lab and Discussion Questions for Measuring Half-Life of a Radioisotope
Related Links
Pre-Lab Questions
- In the transformation of Cs-137 to the metastable state of the Ba-137m nuclide, the atomic number increases by one while the mass number remains unchanged. In this process, a neutron in the nucleus is converted into a proton, emitting both an electron (0-1e or 𝛽-) and an electron antineutrino (𝜈̄e). Write the nuclear equation for the transformation of Cs-137 to Ba-137m.
- The isotope Barium-137m is a metastable nuclear isomer. In nuclear physics, the “m” signifies that the nucleus is in an excited, high-energy state rather than its stable ground state. When a nuclear isomer transitions to a more stable state without changing its number of protons or neutrons, it undergoes isomeric transition. During this process, the nucleus releases its excess energy by emitting a high-energy photon known as a gamma ray (𝛾). Because a gamma ray has no mass and no charge, the identity of the element remains unchanged. Write the nuclear equation for the transformation of Ba-137m to Ba-137.
- What trend in the data obtained from the nuclear scaler do you expect to observe?
PROCEDURE
Watch this video of the measurement of radioactivity for Ba-137m using a nuclear scaler. Use the student handout data table to record data from the video.
- Collect three background radiation counts and record each count in the student handout, "Data Table for Measuring Half-Life of a Radioisotope."
- When all three background counts have been recorded, determine the average count for background radiation.
- Use eluting solution to separate the Ba-137m from the Cs-137 isogenerator. Collect 7 drops of the eluted solution on a steel planchet and place the planchet on a sample collection tray.
- Immediately place the sample tray in SLOT 2 of the nuclear scaler and take a 60 second (1 minute) count. Observe the radiation count after 60 seconds and subtract the average background count from the displayed value. Record the adjusted radiation count in the data table.
- Continue taking 1 minute radiation counts of the sample, but only record EVERY OTHER count (t = 1, 3, 5, 7 ... 19 minutes).
DATA ANALYSIS
On a sheet of graph paper, draw intersecting x- and y-axes with the origin located in the bottom left corner.
Label the y-axis: Count of Ba-137m atoms.
Label the x-axis: Time (in minutes).
Plot the points from the data table as an ordered pair (x,y).
- The 'x' is equal to Time (in minutes).
- The 'y' is equal to Ba-137m Count.
Draw a smooth, best-fit CURVE through the data points.
Find the point on the y-axis where the number of Ba-137m atoms is exactly one-half of the atoms at time = zero. Starting at that value on the y-axis, draw a line parallel to the x-axis until the line reaches the best-fit curve.
When the parallel line reaches the curve, draw a vertical line DOWN to the x-axis.
The point at which the vertical line intersects the x-axis is the time required for half the nuclei of the Ba-137m radioisotope to decay.
DISCUSSION QUESTIONS
- What did you find to be the half-life value of Ba-137m?
- Using the half-life value of Ba-137m, how much time would pass in a total of three half-lives of this radioisotope?
- In a sample of 3,000 Ba-137m nuclides (atoms), how many would remain at the end of three half-lives?
Radiocarbon Dating
BACKGROUND1
Radioactive decay is a first-order kinetic process. As a first-order kinetic process, the rate is proportional to the number of radioactive nuclei, N, in the sample:
Rate = kN
The first-order rate constant, k, is called the decay constant. The rate at which a sample decays is called its activity, and it is often expressed as the number of disintegrations observed per unit time.
A first-order rate law can be transformed into another highly useful equation:
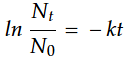
In this equation, t is the time interval of decay, k is the decay constant, N0 is the initial number of nuclei (at time zero), and Nt is the number of nuclei remaining after the time interval. Both the mass of a particular radioisotope and its activity are proportional to the number of radioactive nuclei. Thus, either the ratio of the mass at any time t to the mass at time t = 0 or the ratio of the activities at time t and time t = 0 can be substituted for Nt / N0 .
The relationship between the decay constant, k, and half-life, t1/2, can be represented as:
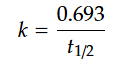
Thus, if we know the value of either the decay constant or the half-life, then we can calculate the value of the other.
Example Calcuation
A wooden artifact from an excavation site is claimed to be 4,000 years old. A sample of the wood is analyzed and shows a carbon-14 activity of 8.0 decays per minute. A new, living sample of wood has a carbon-14 activity of 15.3 decays per minute.
What is the age of the wooden artifact? Is the artifact authentic? Why or why not?
Example Calculation Solution
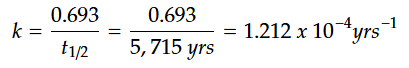
For calculations involving the carbon-14 dating method, we will use t1/2 = 5,715 years.
STEP 1: Calculate the decay constant using the known half-life value.
STEP 2: Solve for time, t.
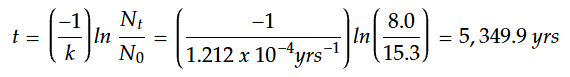
Carbon dating analysis indicates an age of approximately 5,350 years. This differs from the claim that the artifact is 4,000 years old. Possible reasons for the discrepancy could include:
- Contamination: Small amount of modern carbon could have been introduced to the sample making it appear younger.
- Fabrication: The artifact could be an intentional forgery made from wood that is older than the claimed date.
- Experimental error: There may have been imprecision in the measurement of the sample's activity.
Radioactive Decay Calculations
Student Handout: Radioactive Decay Calculations
For this activity, students will observe the following artifacts in Table 1 and read the corresponding information. Students will use the equations explained above to calculate the age of each artifact. When the age of each artifact has been calculated, students should determine whether the provided artifact is authentic or fake and include arguments to support their findings.
| Artifact Number | Artifact Picture | Artifact Information |
| 1 |
|
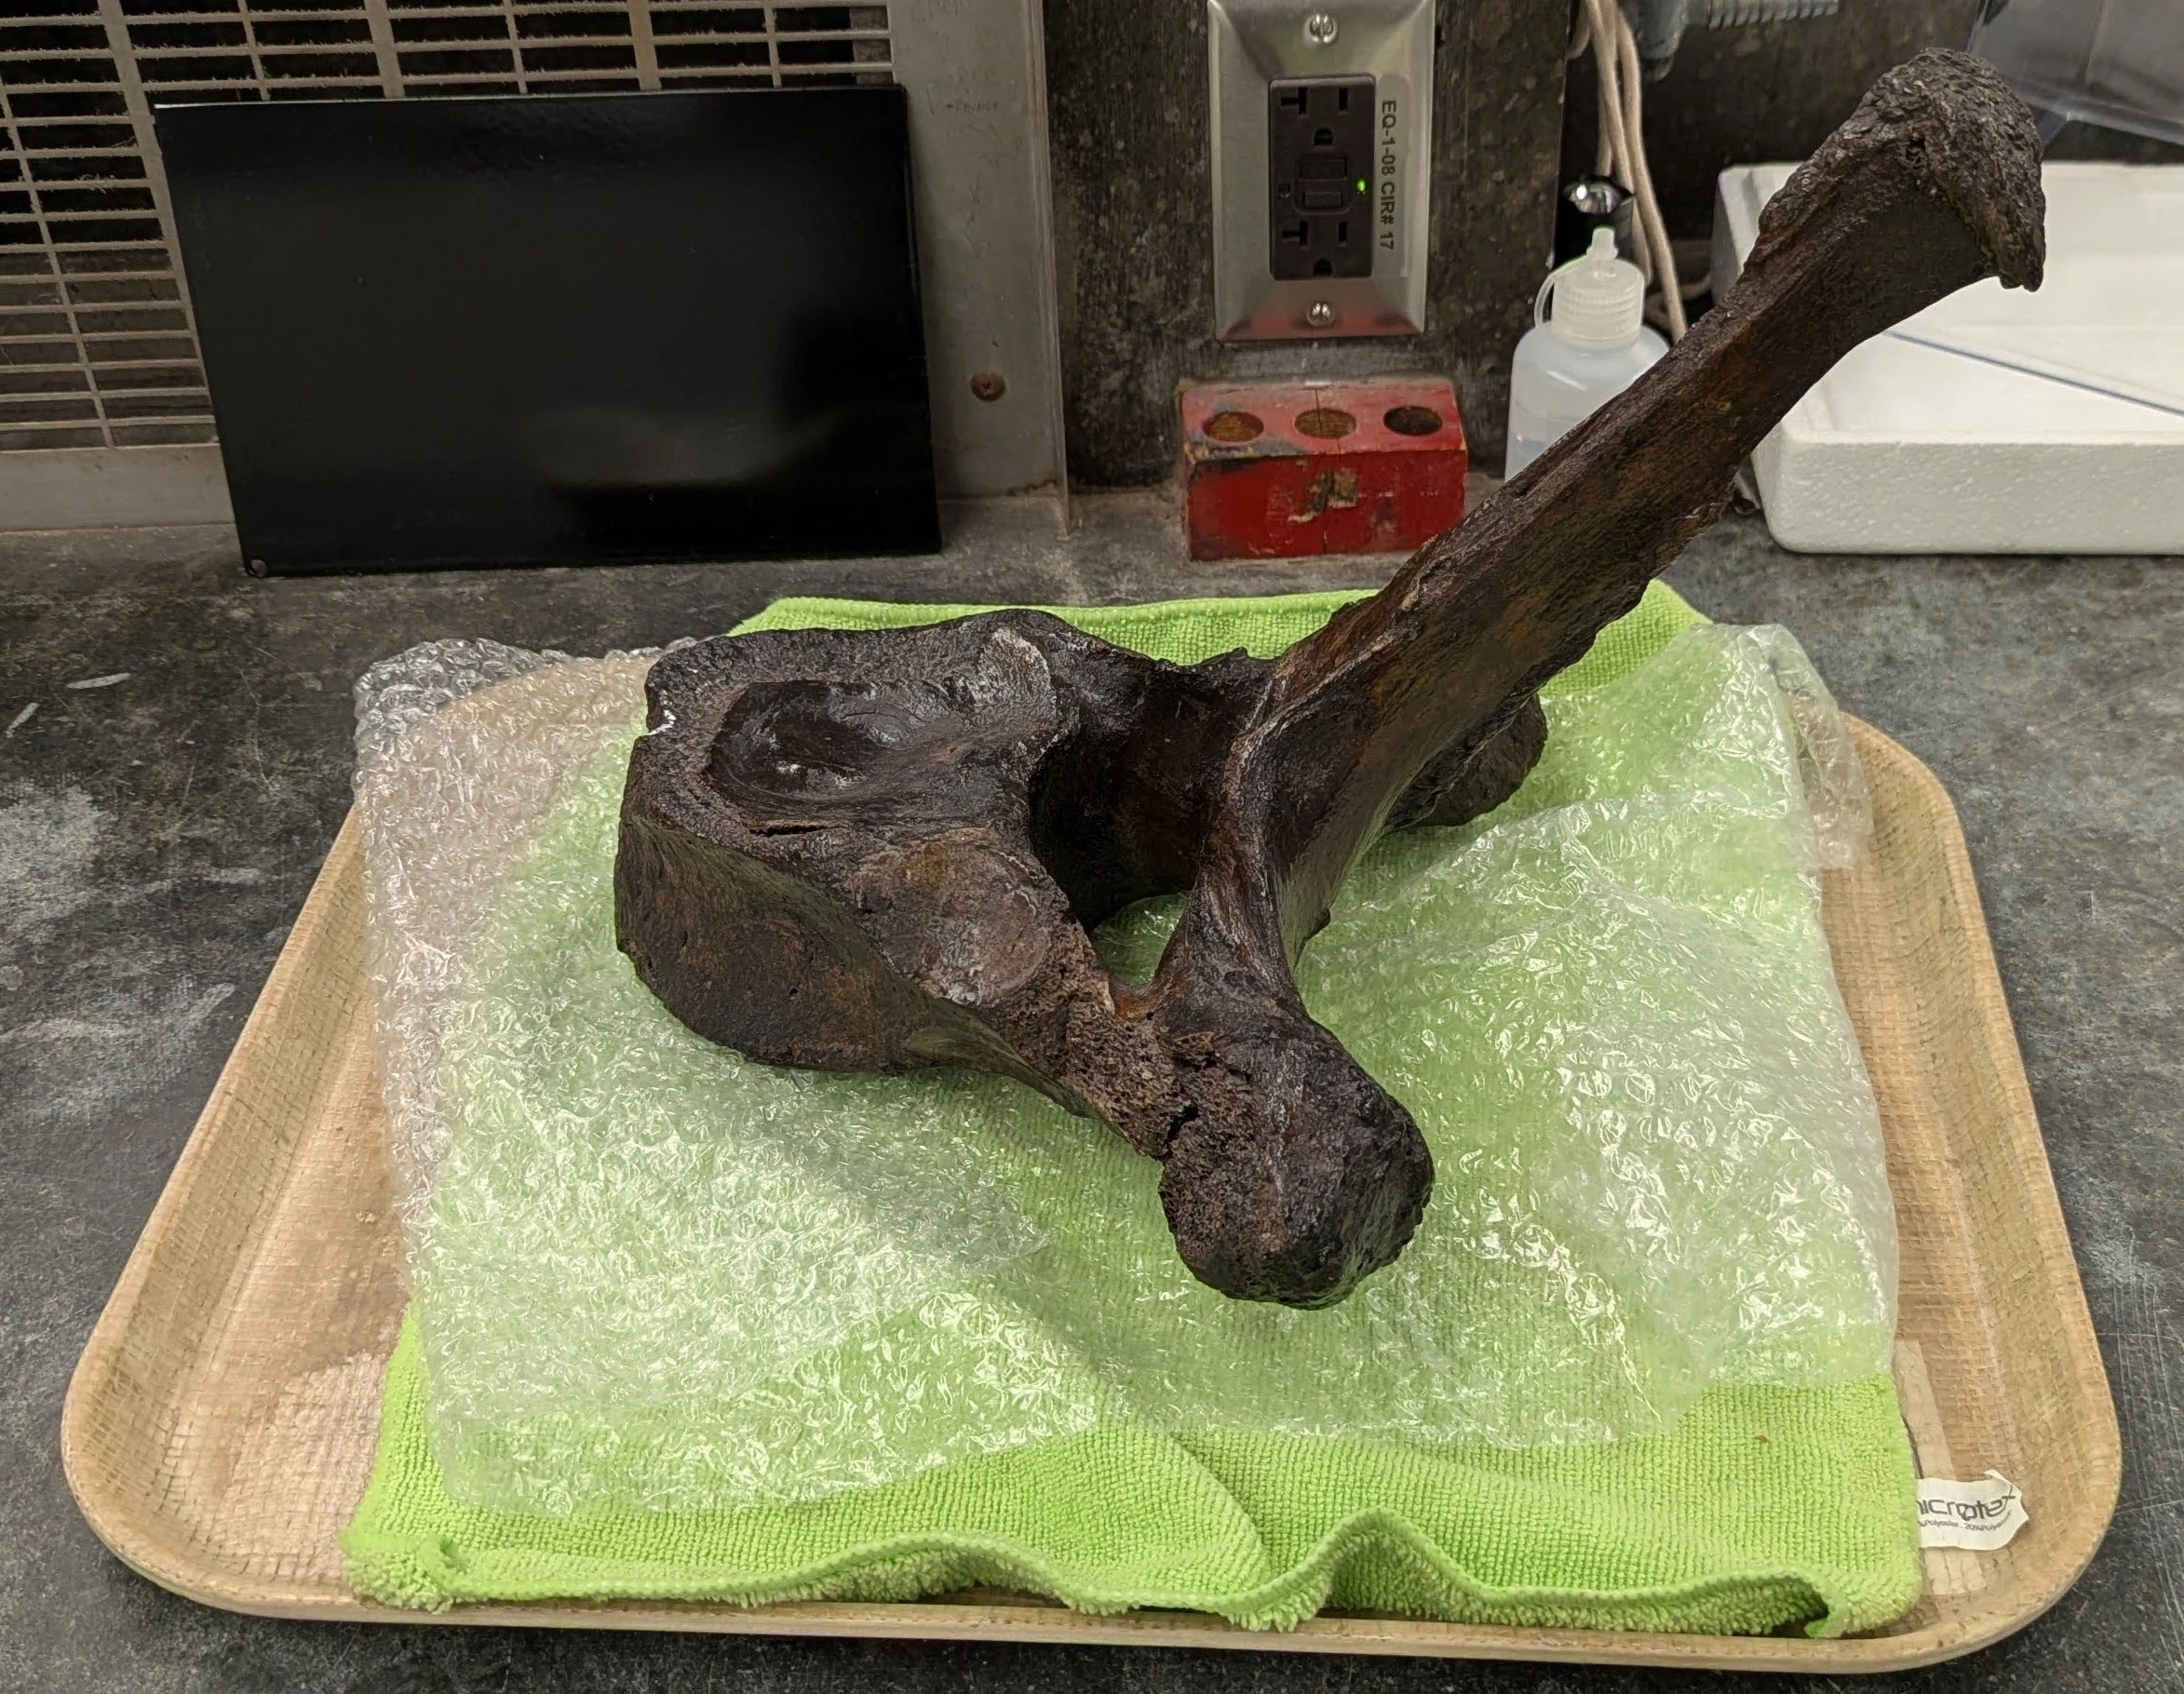
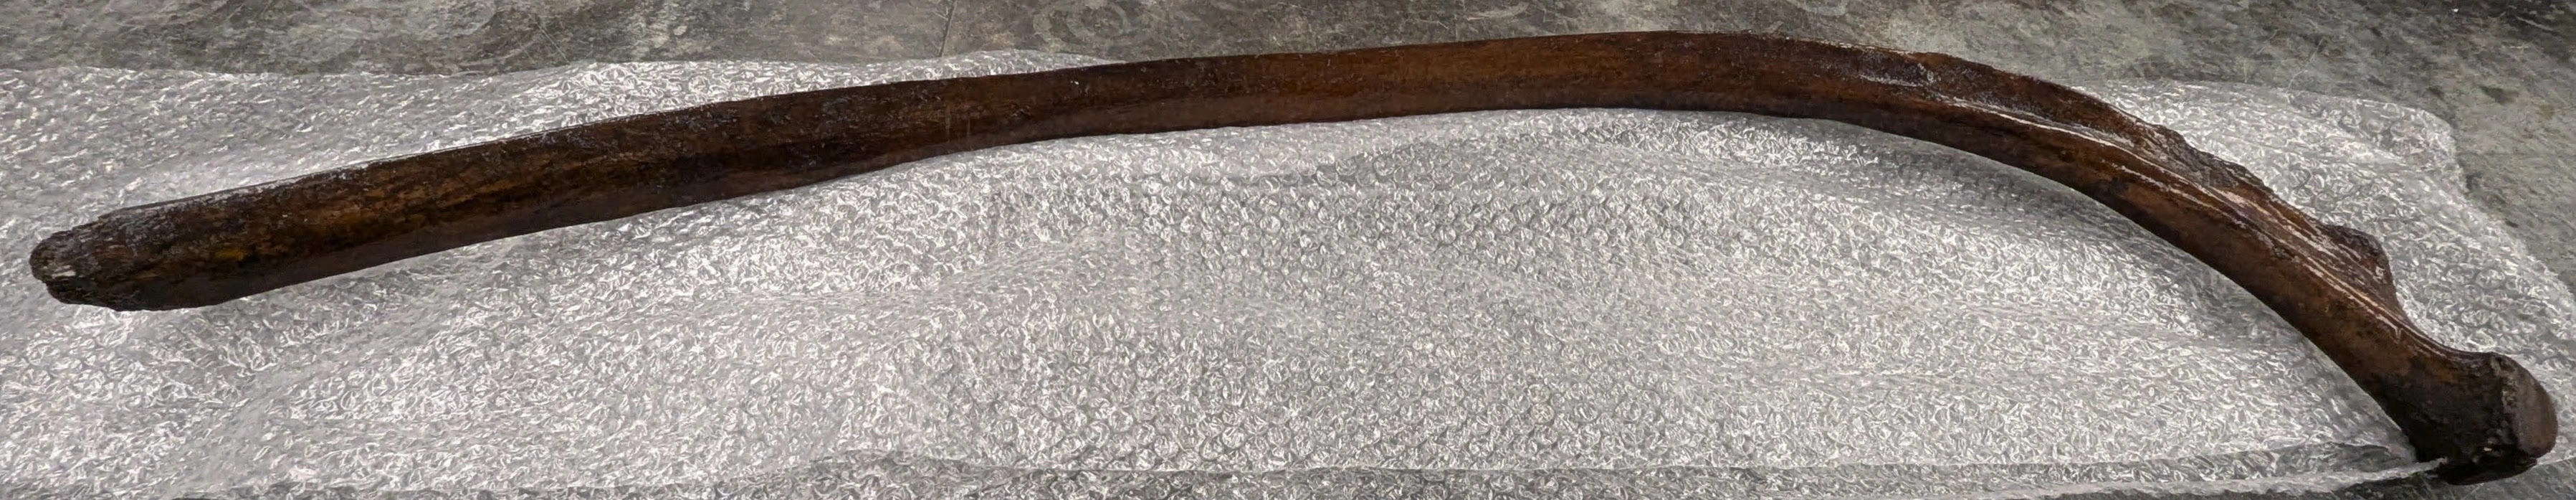
This Mastodon vertebrae from an excavation site here in Indiana is claimed to be over 12,500 years old. A sample of this bone was analyzed and shows a carbon-14 activity of 14.2 decays per minute per gram of carbon. A recent rib bone from a dairy cow has a carbon-14 activity of 15.4 decays per minute per gram of carbon. |
| 2 |
|
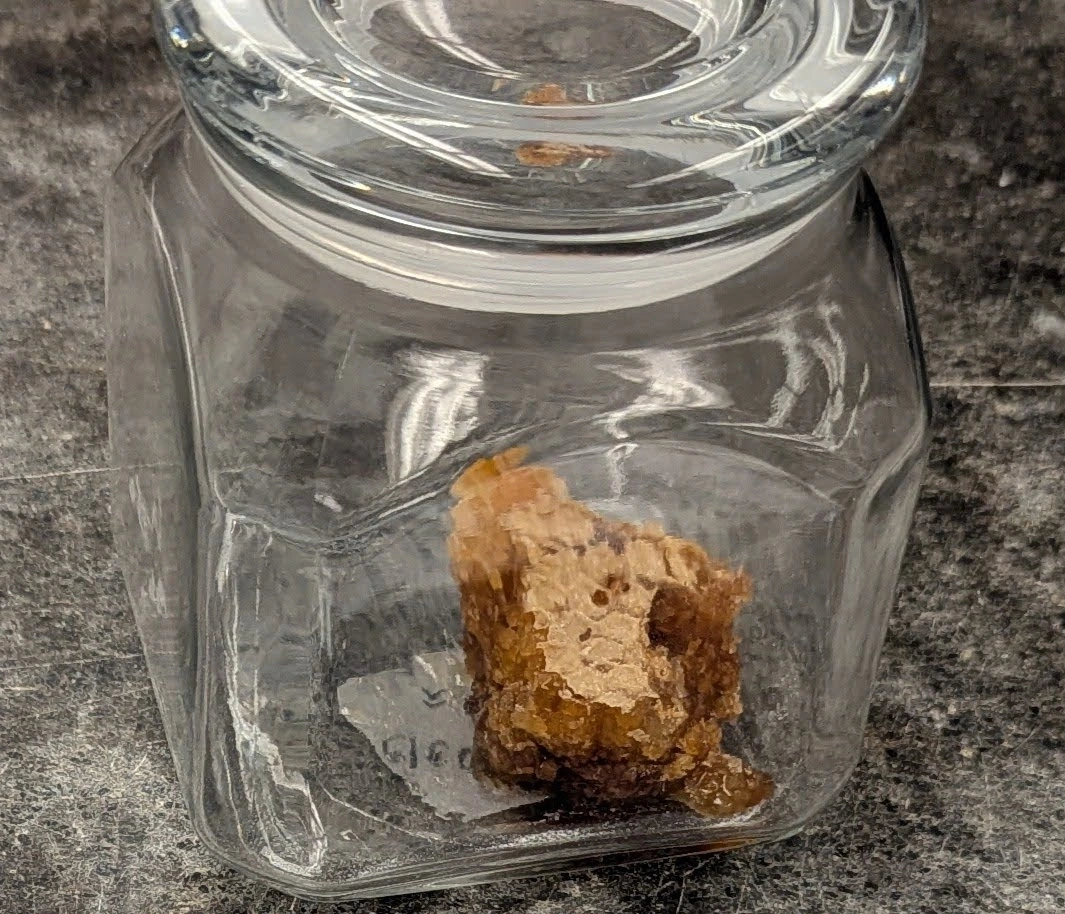
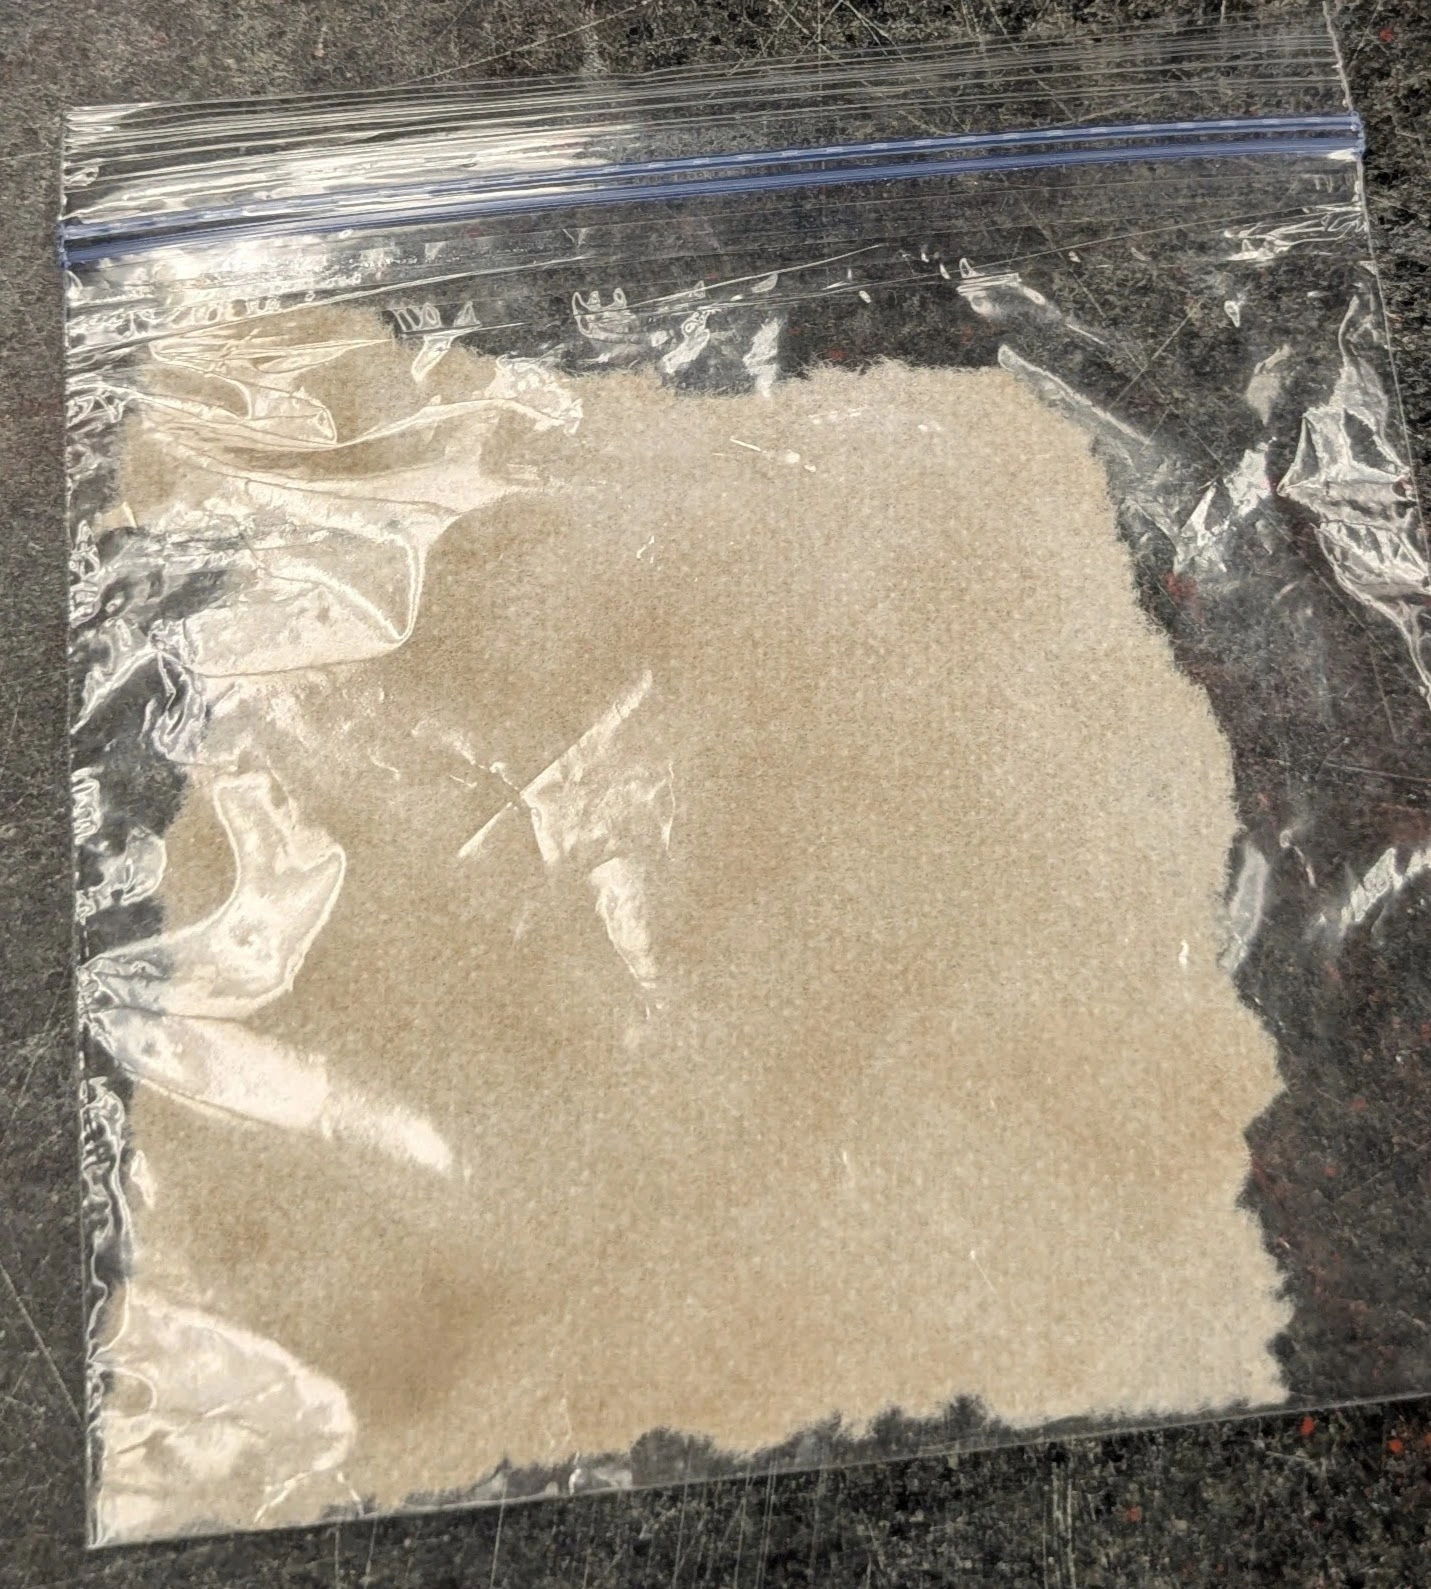
This sample of honeycomb is believed to have been recovered from Cleopatra’s tomb and is said to be over 2,000 years old. A sample of this honey was analyzed and shows a carbon-14 activity of 11.9 decays per minute per gram of carbon. A recent sample of honey from Egypt has a carbon-14 activity of 15.3 decays per minute per gram of carbon. |
| 3 |
|
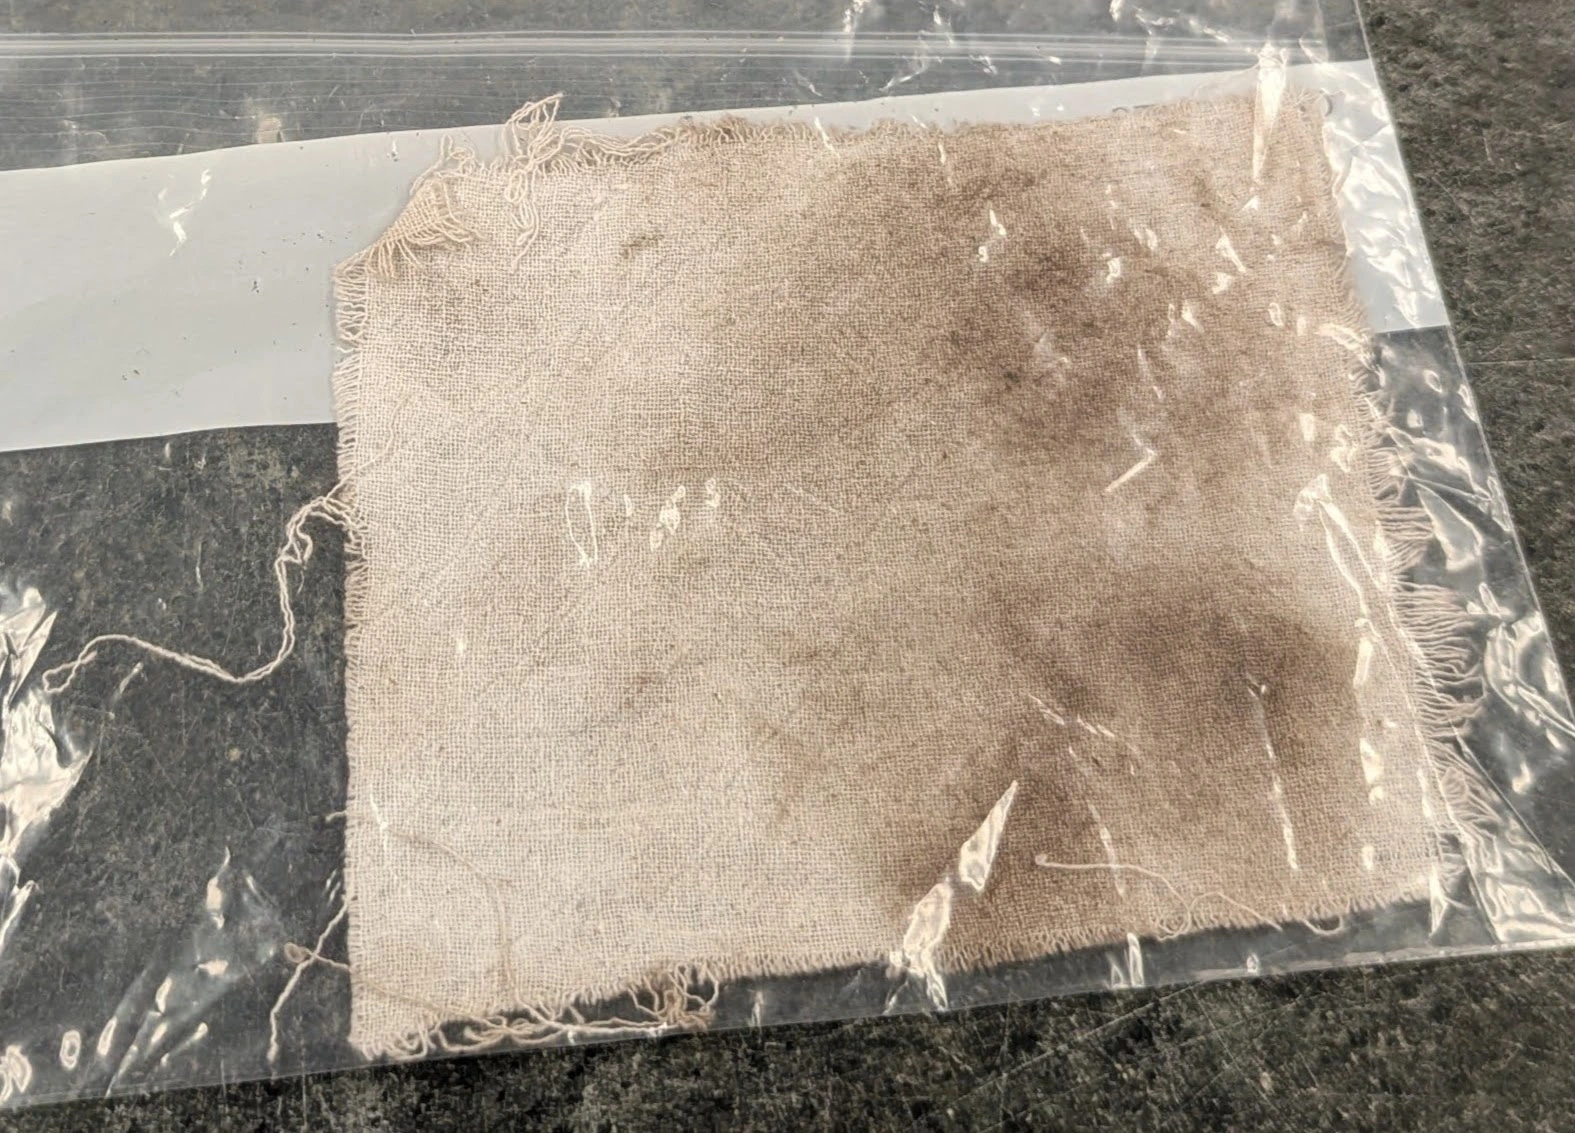
This burial cloth was recovered from a recent archaeological dig that took place near Valsgärde in Sweden. The cloth is believed to have belonged to an elite warrior who pledged allegiance to a king in Uppsala. Experts claim this burial cloth is over 1,400 years old. A sample of this cloth was analyzed and shows a carbon-14 activity of 16.8 decays per minute per gram of carbon. A recent sample of sheep’s wool was analyzed and shows a carbon-14 activity of 15.6 decays per minute per gram of carbon. |
| 4 |
|
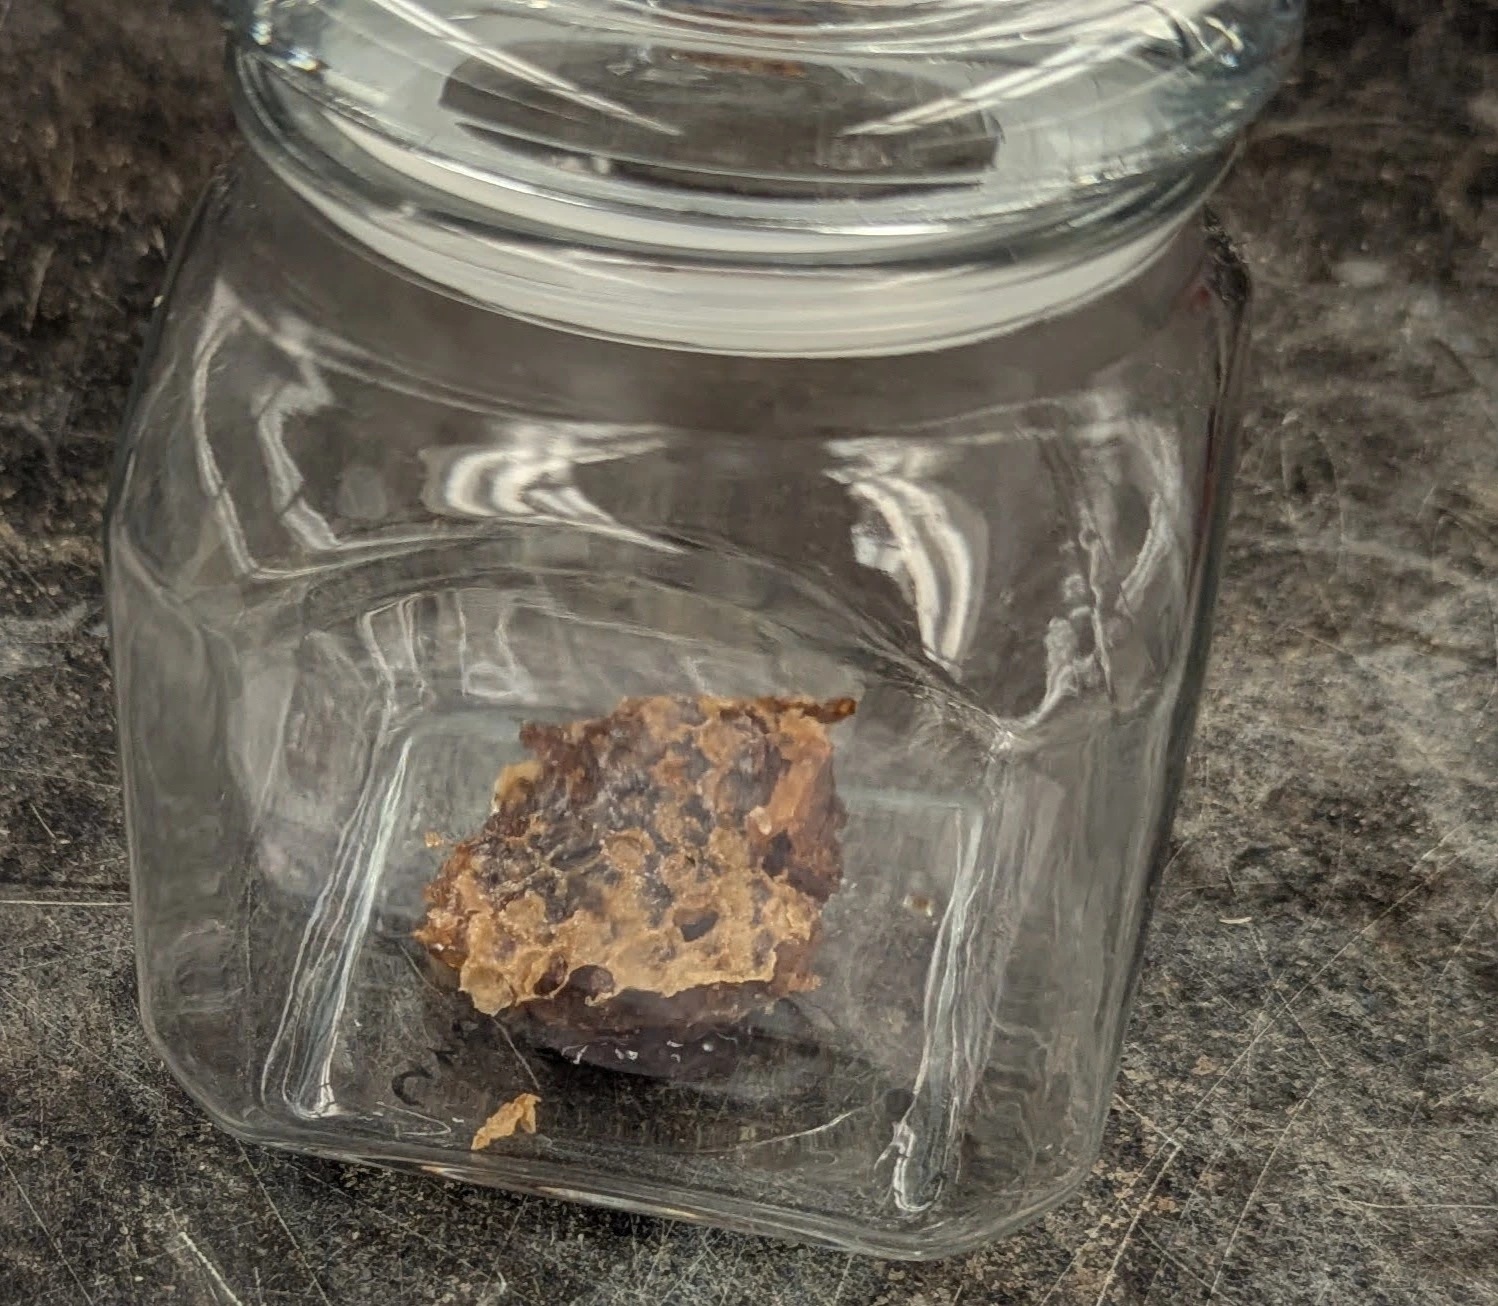
This sample of honeycomb is believed to have been recovered from King Tutankhamun’s tomb and is said to be over 3,300 years old. A sample of this honey was analyzed and shows a carbon-14 activity of 14.5 decays per minute per gram of carbon. A recent sample of honey from Egypt has a carbon-14 activity of 15.5 decays per minute per gram of carbon. |
| 5 |
|
This Mastodon rib bone from an excavation site here in Indiana is claimed to be over 12,500 years old. A sample of this bone was analyzed and shows a carbon-14 activity of 3.4 decays per minute per gram of carbon. A recent rib bone from a dairy cow has a carbon-14 activity of 15.5 decays per minute per gram of carbon. |
| 6 |
|
This burial cloth was recovered from a recent archaeological dig that took place near Herlaugshaugen mound in Norway. The cloth is believed to have belonged to the historical figure Herlaug who has been mentioned in Norse sagas. Experts claim this burial cloth is over 1,300 years old. A sample of this cloth was analyzed and shows a carbon-14 activity of 13.1 decays per minute per gram of carbon. A recent sample of sheep’s wool was analyzed and shows a carbon-14 activity of 15.4 decays per minute per gram of carbon. |
1 - Brown, T. L., Le May, Jr., H. E., & Bursten, B. E. (2000). Chemistry: The Central Science (8th ed.). Prentice Hall.
This lab was created with support from Professor Nathaniel Lifton at Purdue University with funding from the National Science Foundation grant NSF AGS-2303294.